Leveraging Sales, Content and Value Enablement Insights to Drive Revenue Performance
If you ask a sales rep, manager, or leader: “What is your least favorite meeting of the week?” almost all of them would say the dreaded Forecasting call.
Clearly, forecasts are important, to assure predictable revenue and that growth goals are met, but how effective are the meetings … heck, how effective is the forecasting itself?
When we look at how much time is spent, Hubspot says that the average sales rep squanders 2.5 hours each week on forecasting, all with an individual accuracy rate of only 75%. Looking in aggregate, 80% of companies miss sales forecasts by 25% or more, according to MillerHeiman.
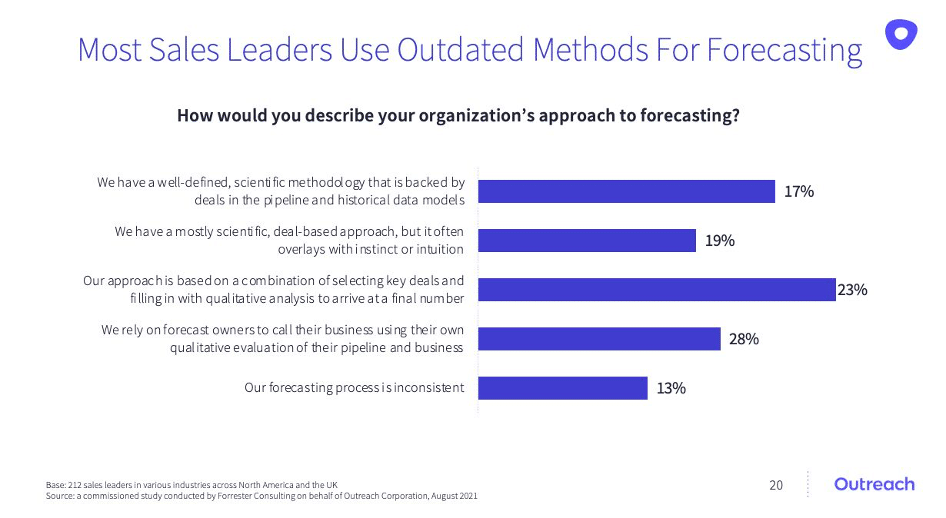
Why is forecasting such a time drain and not accurate at all? There is a decided lack of data and science being applied. When sales leaders were recently surveyed by Forrester Consulting, they indicated that 28% of forecasts were still based on seller self-estimates and 23% leveraging select deal inspections and gut feel. Only 17% of organization’s approach to forecasting could be considered scientific.
The rest, a whopping 83% do not know what opportunities are tracking correctly, where coaching and resources should be directed, and as a result have a serious blind spot to predictable revenue and performance.
Voodoo forecasting, leveraging chicken bones and entrails versus data and intelligence is no way to optimize your opportunities and manage your forecasts. Something needs to change.
Islands of Data?
Forecasting and managing sales opportunities is a challenge, but one worth addressing, as it’s impossible to know where to prioritize opportunities, how to coach for next steps and success, and how to deliver predictable revenue without addressing head on. So what makes this so difficult to solve?
In a recent EVOLVERs event for sales and enablement leaders, it became crystal clear that digital sales transformation is in full effect, which has led to more technology being deployed and available to sellers, enablement and leaders. This has helped create and enable a more modern, digital seller, deploying sales tech to help improve productivity, training, coaching, capabilities and customer engagements.
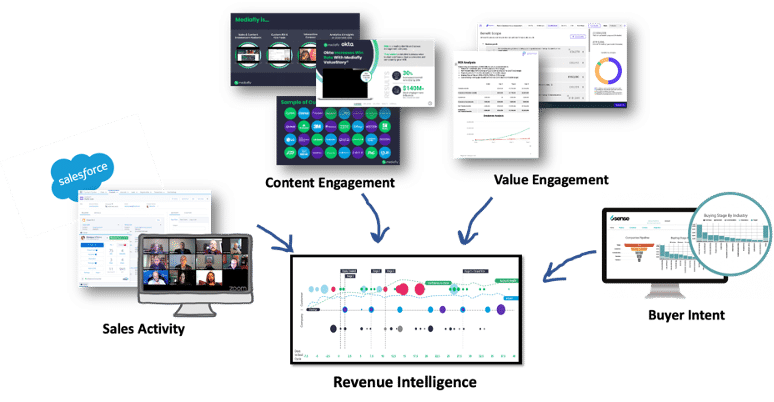
Think about all the different systems leveraged by revenue operations – CRM, conversation intelligence, content management, learning management, value enablement, success management, virtual meetings, e-mail, marketing automation, ABM to name just a few. Even though each element of the revenue tech stack has incredible information which could be used to inform the forecast, each sales, marketing and customer support system has their own island of intelligence and insights.
What if you could pull together more of the information across these systems, breaking down the barriers between seller’s activity, the engagement with content and value, and the customer’s sentiment and intent? Could this knowledge about activity, engagement, and intent help to provide a health check on and inform the opportunity and provide a more intelligent and scientific forecast?
This is what Revenue Intelligence is all about and designed to accomplish.
What Revenue Intelligence Data Should Be Leveraged?
Your revenue tech stack contains a wealth of activity, engagement and intent information, that if aggregated and visualized, could provide insights to inform the forecast and drive optimization, predictability and success.
And that is just the start, because once aggregated, visualized and delivering insights, this data can be leveraged by AI / ML to drive automation, predictions and optimization even further. This is the definition and intent of Revenue Intelligence.
The data points that should be aggregated and visualized to enable Revenue Intelligence include:
Sales Activity
- Meetings have been conducted and who were the attendees
- Communications to the buying group, such as emails and phone calls
- Conversations and intelligence on what has been communicated and the construct/ sentiment of the communications
- The progression of the deal through the sales stages
- The cadence of interactions
Content Engagement
- The content that was shared in and after meetings
- What content has been shared at each stage of the journey and lifecycle
- How the content has been consumed by the buyer
- How the content was shared with other key members of the buying committee, and which committee members that you would expect are missing
- How much time and with which specific content components did each stakeholder interact with
Value Engagement
- The key objectives and challenges the buyer would like to address
- The use cases and solutions proposed
- The cost of “do nothing” with the legacy solutions and status quo (the pain)
- The predicted outcomes from proposed solutions
- The estimated investment and expected return on investment (ROI)
- How well the buyer has performed on prior projects, with solving challenges, implementing use cases and achieving predicted outcomes and realized ROI
Buyer Intent
- Indication as to whether the buyer organizations is actively looking for a solution in your market segment
- How these accounts are interacting with your web site and community content
- How the accounts are interacting with other sites, from 3rd party trusted sources and your competitors
Although many sales technology platforms today analyze important customer data points from sales activities, these systems lack a crucial indicator of the overall health of a deal – multichannel content engagement, value engagement and buyer intent. As we examine the metrics needed to properly fuel Revenue Intelligence, it is apparent that additional data points be aggregated into a centralized hub, not just relying on sales activity but expanding to include the content, value and intent metrics that can provide revenue teams with a more 360 degree view of the opportunity and forecast, as well as extending post-sale to monitor customer activity and engagement throughout the customer lifecycle, to provide an indicator of churn, expansion and account health.
Visualization – Telling a Story with the Data
It is important to gather and visualize these activity, engagement, and intent metrics across the customer journey as part of a revenue intelligence system, to help sales and revenue operations leaders accurately assess opportunity health, improve forecasting, and drive deal wins.
Instead of relying on partial insights obtained during forecasting meetings or voodoo estimates, revenue intelligence captures engagement and intent from the first interaction on the corporate website during awareness, to sales meetings and follow-up sharing from sales reps during exploration and decisions making, to provide a holistic view of the opportunity energy, deal pipeline and prescriptive next steps to help the buyer make the best decision possible and help accelerate the deal to “Yes”.
Visualization of these metrics can help sales leaders, managers, operations and reps to better understand the data, as the picture, when properly constructed, can tell a story.
To this end, we have a few examples of Revenue Intelligence visualization to explore:
1. Opportunity Kinetics
2. Buying Committee Reach
3. Sales Pipeline Health
Opportunity Kinetics
To determine the ability to get each opportunity to “Yes”, visually examining a timeline of the deal to see the activity, engagement, and intent all in one time-based view can provide some incredible intelligence and insights on the priority, health and odds of the deal closing.
In this graph as an example, the various data points are plotted over the opportunity lifecycle, from first contact through close (and even beyond to plot account health). This can be designed to highlight each meeting, correspondence, content share, value engagement and buyer intent motion, with the importance and intensity of the element reflected in bubble size.
A chart with low activity, with spread out smaller bubbles has less kinetic energy than a chart with more bubbles, closer together and with greater size. And as engagement intensifies or wains over time, this can easily be plotted and visualized, assuring that just qualitative feedback from the rep, voodoo, is not what is driving forecasts or deal prioritization and coaching.
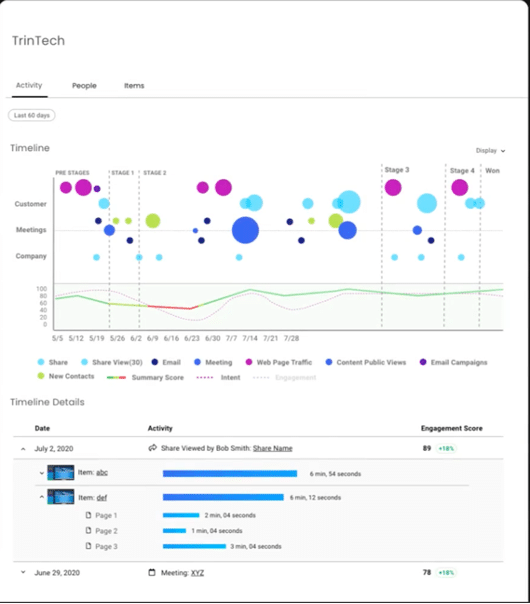
The visualization can also provide not just imaging of opportunity kinetics, but details needed to inspect, learn and better understand. Each element in the visualization can provide drill-downs to provide details on the particular activity, engagement or intent indicator, exploring the activity, reviewing the content shared and consumed, and intent activity.
Buying Committee Reach
With more Executives, Finance and stakeholders involved in each purchase decision, it is vital to not just visualize the kinetics of the engagement, but also understand the buying-committee reach. Miss an executive scrutinizing the purchase, a finance leader who is being frugal, or some key stakeholders who typically are involved but didn’t get engaged, and the deal likely won’t reach consensus and obtain approval.
So, it is vital to provide visualization of the reach, denoting which buyers have direct activity (meetings and communications), engagement with content and value, and are showing intent. The visuals can also leverage a gap analysis, highlighting where typical resources that are involved, but may be missing from being identified and being engaged.
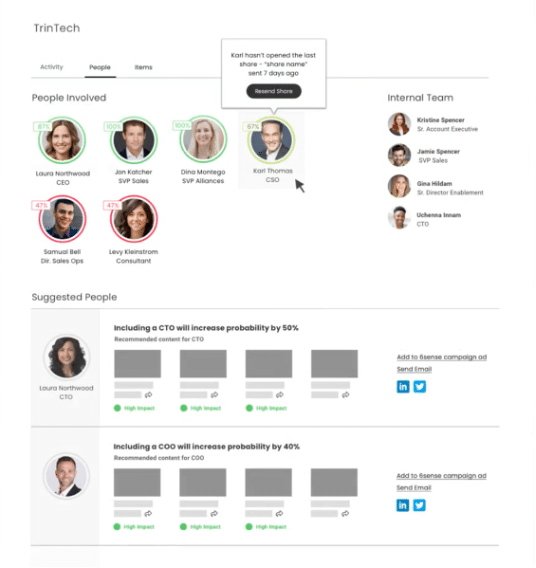
For each buying committee member, details are available with a point and click, to highlight the specific activity, engagement and intent details that are occurring (or not occurring) for each role that participates in the buying decision.
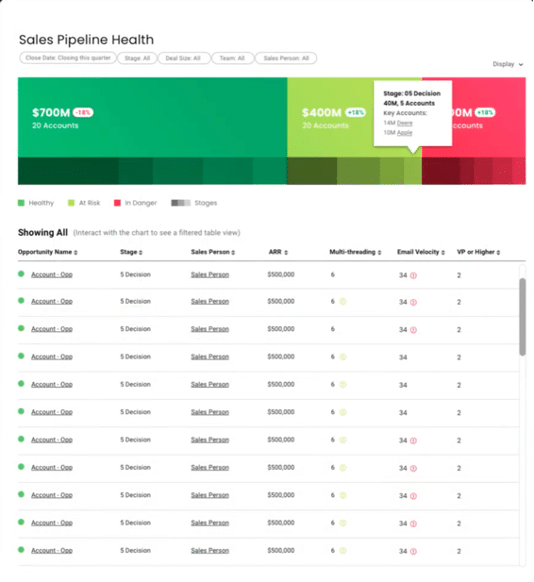
Sales Pipeline Health
Forecasts based on personal feedback from the sales rep on each deal and intuition, need to be replaced by data driven insights, which can lead to more predictable forecasts and revenue performance, with much less time and work.
Looking across the opportunities for a sales rep, group, region and the entire team, the revenue intelligence as to sales activity, content engagement, value engagement and buyer intent can be aggregated to create a heatmap and score.
A pipeline and team roll up can help visualize using data and science where the forecast is predicted to end up. From the heat-map indications, drill downs can be provided to help transparently explore the components of the forecast – what deals the revenue intelligence system says are expected to close, and which opportunities are at risk or predicted to stall or fallout.
Gap analysis and AI / ML
Once you have the information aggregated and visualized, and you tally the activity, engagement and intent data with win rates, deal size, time to close and customer lifecycle value (the long-term health of the customer), the next is to let the machines do the heavy lifting.
Leveraging AI and ML correlations and patterns can be uncovered. What positive activity, engagement and intent led to a better deal outcomes? What deficits in the activity, engagement and intent led to fallout and a poor deal outcomes? And most important, per different account types, industries and solutions, which activity types and cadence, roles engaged, content shared and consumed, value indicators and predictions made a difference?
Once the correlations and patterns are highlighted, learning can occur, so that the AI / ML can provide predictive next step advice to get an opportunity back on track, reduce forecast risks and improve deal outcomes.
The Bottom-Line
A wealth of data is either not available and unused when trying to optimize opportunity outcomes, perform better forecasting and drive more predictable revenue growth. Unfortunately, many companies rely on partial insights from CRM or qualitative feedback from sales reps following their customer meetings. While these insights are helpful, accuracy, optimization and predictability remain elusive by relying on intuition and voodoo versus data science and intelligence.
With the move to digital selling and the wealth of new sales tech that has been deployed in all aspects of selling, revenue teams have a unique opportunity to secure a more comprehensive and holistic view of the entire opportunity and account, and the aggregation of this up to the deal pipeline and overall forecast.
Adding revenue intelligence to your sales tech stack can help prioritize your selling activities to create a more effective sales team, deliver better coaching and recommendations to optimize sales leadership, and deliver better forecasting to drive more predictable revenue growth.
Checkout our take on Revenue Intelligence in this on-demand session with Carson Conant, CEO / founder of Mediafly
https://assets.mediafly.com/l/s3mV32J5ZUQ2
Sources:
- Forrester – https://pages.clari.com/forrester-revops.html
- Hubspot – https://blog.hubspot.com/sales/sales-forecasting
- Outreach / Forrester Consulting – https://www.outreach.io/blog/modern-revenue-teams-require-a-modern-platform
- Miller Heiman – https://www.millerheimangroup.com/resources/blog/the-top-four-challenges-in-sales-forecasting-and-how-to-right-them/
#RevenueIntelligence #Revenue360 #Salesforecast #salesoptimization #salesenablement

Comments are closed.